Dylan Moriarty: AISES 2019 Most Promising Engineer
American Indian Science and Engineering Society recognizes UArizona civil engineering alumnus and Sandia National Laboratories geoscience engineer.
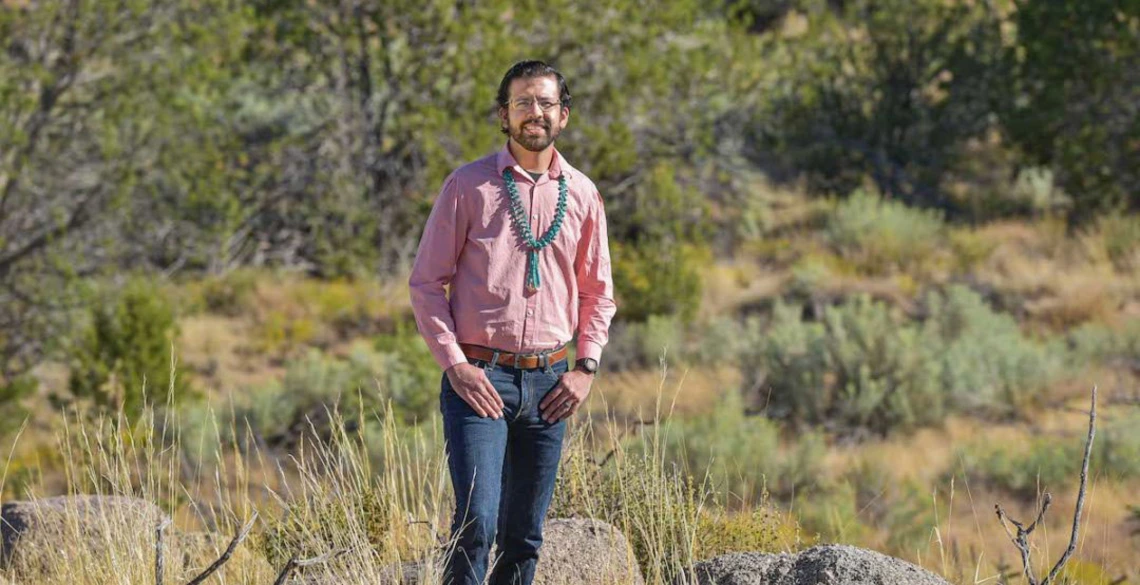
Dylan Moriarty, who earned his UArizona bachelor's degree in 2012, receives recognition from the American Indian Science and Engineering Society. (Photo: Randy Montoya / Sandia National Laboratories)
Though he had no idea of it at the time, Dylan Moriarty started training for his current job at New Mexico-based Sandia National Laboratories when he was a young boy. Moriarty grew up in rural Fort Defiance, Arizona, on the Navajo Nation.
“The one resource we have plenty of is dirt,” says Moriarty, this year’s winner of the Most Promising Engineer or Scientist award from the American Indian Science and Engineering Society. “When it would rain, I would go down to the wash and make dams and play around with the natural systems. I would also play with Legos, and, though I didn’t know it at the time, what I really liked was solving problems.”
A lot has happened in the years since Moriarty was playing in the dirt, including his obtaining a bachelor's degree in civil engineering from the University of Arizona in 2012 and a master's degree in energy resources engineering from Stanford University. But at some level, Moriarty is still using the skills he unknowingly began building as a kid. Today, as a geoscience engineer at one of the nation’s premier research laboratories, Moriarty works on the challenge of infrastructure resilience -- think of water networks or traffic -- using spatial statistics. “I take my knowledge of Earth systems and infrastructure systems and apply statistics to gain an understanding and solve challenges,” he says.
Moriarty says that people’s eyes generally glaze over when they hear that explanation, which is why he has a handy way to illustrate what he does. Think about the weather forecasts we’ve all seen that feature heat maps showing the high and low temperatures in different states.
“That data is collected from weather stations, but there aren’t data collection stations everywhere,” he explains. “Spatial statistics help you understand what’s going on in between those stations.”